
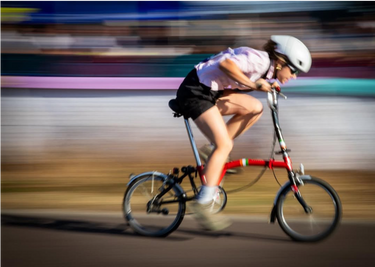
I could taste iron in my mouth, my heart rate soared into the 190s, legs spinning out into the triple digit rpms, rhinestones, pom pom streamlines and ties whizzed passed me, as I lurched my bike across the finish line of the Brompton Bicycle World Championships at the Lee Valley Velodrome. I could hardly push another flat pedal as I hung my head over the iconic Y handlebars of the metal racing red frame, held together by multiple twisted clips, donning my green, white and gold electric tape and stickers.
This was one of the most eccentric, and strenuous races I have ever toed the line of, and certainly one I did not have on my bucket list or race calendar, which was until now only strewn with ultra distance marathons, and overnight epic bike rides.
There was a plethora of factors riding against me as I entered the Lycra absent gladiator arena; a bike half a decade older than I was, which veterans of the sport pointed out with glee and awe at its vintage, a 1995 ‘L Model’ – lore I was certainly not read up on. I was at the mercy of the unfamiliarity to the nuances of bedazzled suit racing, the intricacies of optimal bike unfolding, and the art of flat bar pace lines. I succumbed to the 3 gears affixed alongside my glimmering bell, each appearing to meld into one single speed, speed 3, which tested my cadence as I spun out at 120 rotations per minute around the rolling terrain of the velo park. Had I had more options there, I possibly could have fought out that sprint finish and taken a podium position – I guess we’ll never know.
But I had one thing in my arsenal that was possibly overlooked by my competitors. Certainly, existing in the realm of high-performance road bikes and intelligently engineered time trial bikes. This was an engineering feat in its own right, own dimension in time I daresay. Surely these quirky contraptions didn’t defy the laws of physics and aerodynamics testing too? What I lacked in Brompton experience, could I possibly make up for in aerodynamic optimisation? I had attempted to use this idea to my advantage during the qualifying and final stages of the Sunday racing; rightfully touted as ‘Aero Girl’ by the fabulously dressed commissaire each time I passed by the electric spectator area, as I adopted an aero tuck, one for the Grand Tours, forearms firmly locked in a 90 degree angle as best I could on these mini Harley Davidson handlebars, my Trek Ballista firmly dug into the top of my spine, my saddle height eyeballed correctly during unfolding to allow for a flat back. It was time to dive into the test matrix and unfold my own area of expertise.

The Aerodynamic Setup
This was an opportunity to go back to basics. Well, highly advanced and engineered basics, in the mode of a field test. What better way to celebrate this fundamental London commuter bike, birthed from the simple idea to get from A to B, than to do some out-and-back, A to B testing?
I had originally planned to have my Facebook marketplace Brompton tested in the wind tunnel at the Silverstone Sports Engineering Hub. Unfortunately, and probably to no surprise, the stanchions were unable to facilitate my 16-inch wheels. I can perhaps make an argument for more inclusive engineering for those interested in speeding up their daily commute. What I did have in my wind tunnel archives and what would help in my baseline testing, was my own aerodynamic analysis that I completed the week previous. A coefficient of drag area (CdA) measurement of an upright cycling position which I would be adopting for this test. It sat at a not unreasonable 0.358, and from recent field tests, I was within the 0.35 – 0.36 range.
My feather weight Trek Madone resides in the same room as my Brompton, and it is quite comical to compare the reflectors, rim brakes, dusty mud guards, bulky (yet extremely comfy) metal spring saddle and thick circular cross sections to the pinnacle of streamlined optimisation. I was extremely intrigued to compare the two’s performance.
The test was theoretically simple. The physical structure of the system set up equally so, using the Streamlines aerosensor setup, for possibly the first time in the history of the system and Brompton folklore. As a quick introduction of Streamlines: As part of its all-encompassing Cirrus Network, it uses its Altostratus pitot tube, FORMA Body position sensor and TEMPO speed sensor to deliver precise aerodynamic drag measurement by measuring wind speed, position in space and wheel speed respectively. A pocket wind tunnel so to speak. For the Brompton set up, it was almost identical to that of World Champion triathlete; Altostratus attached to the stem, TEMPO on the fork (spoke magnet to avoid clashing with the aforementioned rim breaks), FORMA on the downtube, and Favero Assiamo pedals to measure power, which was already a substantial upgrade to the bike geometry. With each part of the system secured in place, all that was left was to test.

The Test
The test itself was devised as follows:
- Take system weight.
- Tire circumference roll out (one that required a system upgrade to add to the data analysis).
- Warm up – while unrealistic, I did choose to wear a skinsuit for this test. For engineering righteousness in comparing to my road bike, I also wanted to eliminate any noise from a flapping dress shirt or surface roughness interference from a misplaced sequin.
- Baseline – 2 baseline repeats of 6-8 out and backs of an approximately 700m course. I wanted to collect as much data as possible and settled on multiple runs of a shorter track than less of a longer distance. I predicted some position instability compared to what would be seen on a road bike so I figured using more runs to restabilise between each one, and have more measurements recorded per configuration would help data robustness.
- Position optimisation. This was going to be the most difficult part – would I be a consistent enough test subject; on a bike I have only been riding on for the last month?
- Baseline repeat. Easy.
The test area. A flat and straight back road, early enough in the morning to ensure most of the office commuters and school runs had been taken care of, and the spectacle that was about to commence would stay relatively out of sight. For testing integrity as well as protection of my own ego. Cyclists get enough slander as it is, and I was certainly a case to add to the library in this test state.
Some caveats, assumptions and already established test comparisons.
- GCN performed a performance analysis of a Brompton vs a Cannondale SuperSix EVO. This test uses an assumed CdA of 0.401 for the Brompton. Seeing as an upright cyclist is in the range of 0.35 – 0.5 m2 we’ll take that as a good assumption and one we can further base the results off.
- The Brompton is equipped with Schwalbe Marathon Plus tires. Bicycle Rolling Resistance approximates these tires to be in the rolling resistance (Crr) range of ~0.0076 at 60 psi from their benchmark laboratory testing. However, with the 16-inch wheel size creates a wider and shorter road footprint compared to the tested 700cc so must scaled upwards. This gives us roughly a Crr of ~0.008 at 85 psi. I personally prefer a firmer tire, and this is the recommended pressure for city commuting.
- GCN also assumes a 95.5% drivetrain efficiency for its 2-speed comparison. I could dive more into the mechanical details, but for this test, I am focused mostly on the aerodynamics.
- Race analysis: Going back through my Garmin data, which unfortunately did not include power, I compared my race results from the A – Qualifying Lap, and B – Final Lap. A was a mixed gender group, so while I tried my best to jump on a wheel and draft, I was subsequently dropped and rode out the qualifiers mostly solo. That being said, removing the warmup lap, my average speed hung around the 30km/h, with a maximum of 41km/h. The finals were female only, and a tactical paceline ensued. I averaged 31km/h, maxxed out into almost 45km/h with an equally maximum heart rate of 198bpm (no comment). As far as aerodynamics goes, those are speeds where we can start to see some real effects of aerodynamic improvements, so I would also need to make sure my testing speeds could reflect this.
Results
3 hours of testing complete, and several strange looks and questions from the public, I finally concluded on the aerodynamic performance of my Brompton and was pleasantly surprised. It turns out, despite my reservations, this bike is engineered in line to cycling aerodynamic literature, and in hindsight, makes perfect sense that it does. There is no defiance of physics laws here.
Data
Streamlines recorded my test protocol as follows: seven runs, twenty-eight traverses. A traverse is one pass through a 693 m gated section that drops 8.8 m from one gate to the other; a run is a set of out and back.
Configurations A and B are the same position: an upright ‘commuter’ position. I split them because of my position stability reservation. A as my main baseline and B acting as a position repeatability check; three consecutive runs of that same position, followed by C, the aero tuck. Then the last run of the day goes back to A which acted as my baseline repeat to recheck my stability and determine any data drifts.
Note: A1 below is the pooled baselines. For Streamlines, this is best practice for data comparison and post processing. this makes comparison easier and the system works better on the calibrations. Below the A runs are parsed apart for data presentation, but CdA delta is compared to the pooled results.
|
Config |
Description |
Traverses |
CdA (m²) |
Δ vs A1 |
W at 40 km/h |
|
WARM |
Warm-up |
4 |
0.545 |
+0.010 |
519 |
|
A |
Baseline |
4 |
0.524 |
−0.011 |
502 |
|
B |
Position repeat |
12 |
0.514 |
−0.021 |
493 |
|
C |
Aero tuck |
4 |
0.313 |
−0.223 |
324 |
|
A |
Baseline repeat |
4 |
0.546 |
+0.011 |
520 |
|
A1 |
Both A runs |
8 |
0.535 |
— |
511 |

Every traverse, in the order the configurations were ridden. Circles are eastbound, triangles westbound; bars are the mean and its standard error. The two A groups are the same configuration two and a half hours apart, and B is that position again.
Performance statistics
Five of the seven runs are the same upright position — the opening A, the three B runs and the closing A, twenty traverses spread across three hours. In the order they were ridden they came out at 0.524, 0.511, 0.512, 0.520 and 0.546 m². Mean 0.523, standard deviation 0.014, and a spread of 0.036 m². The results produced a coefficient of variation of 2.7%, which happens to be almost the lap-to-lap scatter of the session. (0.0146 m², 2.7%).
The baseline repeats help confirm the repeatability of the data. The first baseline, at 11:09, read 0.524 m². The last run of the day, the same position at 13:44 after the tuck was done, read 0.546. A drift of 0.022 m², about 4%, over two and a half hours.
The aero tuck takes 0.223 m² off the baseline — 0.313 against 0.535, a 42% reduction, worth 187 W at 40 km/h. Measured against all twenty upright traverses pooled, it is 0.210 m² and 40%. Those two answers agreeing to within 0.013 m² where the difference carries a Welch p of 0.0009 and a 95% confidence interval of 0.165 to 0.255 m².
Why the tuck saves so much
Any athlete would be delighted with a 0.223 m² reduction in CdA for a positional change. It is a seemingly unrealistic reduction of an almost 42% decrease, it does make sense when it comes down to the physics and aerodynamics.
In the aero tuck I rode 7.11 m/s on 93 W at the pedals. Upright I rode 6.28 m/s on 102 W. Faster, on less power. To hold the tuck’s speed sitting up would have taken 158 W. Air speed and power are both measured directly, so before any post processing, we already have some definitive performance numbers. CdA is just the aero power divided by the aero power a 1 m² body would absorb at the same air speed, so the raw ratios also highlight the reduction. The aero power went down by 11 W while the reference went up by 48%, because I was going faster:
|
Position |
Aero power |
Reference (Alpha) |
Ratio = CdA |
|
Upright |
75 W |
144 W |
0.519 |
|
Aero tuck |
64 W |
214 W |
0.297 |
The magnitude of the decrease comes down to two separate mechanisms. The first is frontal area. Projected torso height scales with the sine of torso angle. Upright is somewhere around 75°; a forearm tuck is around 35 to 40°. That is a factor of 0.58 to 0.67 on the biggest contributor to frontal area, as well as considering the tuck also pulls the arms inside the shoulder line and tucks the head down.
The second is pure aerodynamics. A cyclist’s drag coefficient is not a constant and it depends on the Reynolds number where, for simplicity, is speed multiplied by the length of a body. The reference length that matters here is the torso: roughly 0.3 m across when you are sitting up, roughly 0.6 m once it is inclined. Tucking doubles it. On top of that, I was riding faster in the tuck, 7.1 m/s against 6.2. Combining these factors gives a Reynolds number result which creates a phenomenon of a low drag region. The product of this phenomenon makes 0.22 m² possible. See the Appendix for a more detailed analysis of Reynolds Number.
A decrease like this would be rare on a road bike, but this is not a road bike test, so the following must also be considering in explaining such a large CdA change:
-
The starting point is much higher: My road bike wind tunnel upright figure is 0.358 m². The Brompton upright is 0.535 — 0.177 m² worse. The Brompton handlebars are high and close, so my torso sits near vertical in a way it never does on a road bike, even in a normal upright position.
-
Geometry interaction: The Brompton is low and the bars are reached by a long stem, so my torso sits in open air. On a road bike, dropping into a tuck puts the torso partly behind bars, stem and head tube that are already disturbing the flow. Here there is less bike in the way, my aerodynamics lands much more on my own position.
-
Nothing defines the end of the movement. No pads, no extensions, no reach limit. I could place myself in a position as far as flexibility allowed, which is further than a time trial fit would normally put me. The same freedom that made the position hard to repeat is what made it so low.
What would this mean in a race situation?
Assumptions first, because this is a model and not a measurement: the Lee Valley VeloPark road circuit at 1.62 km a lap, eight laps, 12.96 km, my race average 30–31 km/h. Rider and bike 70.2 kg, Crr 0.008 as reported, air density 1.18 kg/m³, 97% drivetrain efficiency. The Streamlines model reproduces the session report’s 40 km/h figures at 511 W upright, 324 W tucked.
At a constant 30 km/h the upright position needs 236 W at the pedals; the tuck needs 158 W. A saving of 78 W, or 33%. Aerodynamic drag is 80% of the total resistance even at that speed: 189 W of the 236, against 47 W of rolling resistance.
Held at the same 236 W instead of the same speed, the tuck rides 35.3 km/h. Over eight laps that is 25:55 against 22:00, 235 seconds, very nearly four minutes, or 29 seconds a lap.
This race prediction also comes with its own caveats:
-
It assumes I can hold the tuck for twenty-two minutes. I held it for one run — four traverses, about seven minutes of riding. In the actual race, I really began to suffer lap by lap in such an aggressive position.
-
The model is flat and constant speed. The circuit climbs about 5 m a lap, and the model does not account for any accelerations or cornering.
- Drafting is not modelled: Sitting in a paceline has significant impacts on aerodynamics. While I raced mostly solo for the qualifier, I was in a peloton for the final. Two very different aerodynamic scenarios.
As a final performance note, over the eight laps the tuck saves roughly 122 kJ of work. For a race settled by a sprint out of the last corner, that is arguably the more useful number: not the time on the clock, but what is left in the legs when you get there. As I am not a sprinter even on a traditional bike, I felt every lap in the final meters of the sprint, so I do believe having a more efficient race strategy overall could have saved me here.
Post Study Thought
Brompton Racing is a special event, with so much history, nuance and defiance of what constitutes as ‘normal cycling’. It deserves its own place in cycling, with its own style of race, format, and unwritten rules, which after this study, I came to believe that aero testing may not even be part of it. The Brompton World Champion Race Rulebook maintains that no aero fairings are to be present on your racing bike, therefore my optimisation would not be relying on any sort of time trial extension of between the arm bottle mounts. This left me to my position and race attire selection which of course I could select a more efficient costume for race day. However, in the spirit of real-life applicable engineering as well as that of the heart of Brompton racing, I fear that in optimising my apparel, would lead to de-optimisation of fun where fun seems to be the most mandatory rule.
That being said, I can certainly train my position a bit better as shown here, the aero tuck does have quite a significant improvement on my race strategy. Coming into next year’s race with more than a months’ time of practice, being a bit more versed in a folding bike paceline and maybe a more ridiculous costume can all be part of this optimisation and hopefully lead to a few spots higher up the leaderboard.
I believe there is a certain je ne sais quoi about cycling on a, for lack of a better term, ‘suboptimal’ vintage bike, one that exists in pushing ancient components far beyond their limits, but certainly not past their lifetimes. I could upgrade to the latest drivetrain, swap out to carbon cranks, update my tires, but if we think about our ancestral cyclists before us and their almost opposition of optimisation; steel frames, no helmets, donning cotton jerseys as they powered through to victory with sheer willpower, brute force and determination, a cheeky mid stage cigarette, I think some things are best left to the past, more so as a testament to the robust engineering. These machines were meant to last; when AI finally destroys our electrical systems and we can no longer charge our Di2’s, what would be left in the rubble? My sturdy L line, waiting to take me from A to B, and with my head tucked low, maybe a little bit faster than originally made.
Appendix
CdA figures are the Streamlines normalised values unless the column says raw.
A1. Run by run
|
Run |
Time |
Configuration |
Traverses |
CdA (m²) |
Raw (m²) |
Head (cm) |
Chest (cm) |
|
2 |
10:46 |
Warm-up |
4 |
0.545 |
0.534 |
30.3 |
41.0 |
|
3 |
11:09 |
Baseline |
4 |
0.524 |
0.510 |
31.3 |
41.5 |
|
4 |
11:34 |
Position repeat |
4 |
0.511 |
0.493 |
26.6 |
41.9 |
|
5 |
11:51 |
Position repeat |
4 |
0.512 |
0.493 |
32.1 |
41.9 |
|
6 |
12:07 |
Position repeat |
4 |
0.520 |
0.507 |
27.9 |
40.1 |
|
8 |
12:57 |
Aero tuck |
4 |
0.313 |
0.299 |
35.9 |
36.1 |
|
10 |
13:44 |
Baseline repeat |
4 |
0.546 |
0.528 |
28.4 |
40.8 |
A2. Every traverse
Direction W is westbound, E eastbound. Every configuration has equal numbers of each, so the configuration means are not affected by the direction split. Speeds are in m/s; air speed is what the probe saw, ground speed what the wheel saw.
|
Run |
Configuration |
Dir |
CdA (m²) |
Raw (m²) |
Speed |
Air speed |
Yaw (°) |
Power (W) |
|
2 |
Warm-up |
W |
0.565 |
0.557 |
5.32 |
7.60 |
2.7 |
183 |
|
2 |
Warm-up |
E |
0.517 |
0.501 |
7.68 |
6.08 |
3.5 |
67 |
|
2 |
Warm-up |
W |
0.566 |
0.559 |
5.56 |
7.84 |
2.5 |
196 |
|
2 |
Warm-up |
E |
0.530 |
0.518 |
7.88 |
6.09 |
2.9 |
70 |
|
3 |
Baseline |
W |
0.554 |
0.546 |
5.35 |
7.11 |
2.4 |
168 |
|
3 |
Baseline |
E |
0.494 |
0.466 |
7.66 |
5.44 |
4.8 |
44 |
|
3 |
Baseline |
W |
0.565 |
0.556 |
5.28 |
7.26 |
2.5 |
171 |
|
3 |
Baseline |
E |
0.484 |
0.473 |
7.66 |
5.90 |
2.6 |
55 |
|
4 |
Position repeat |
W |
0.507 |
0.495 |
4.93 |
6.80 |
3.0 |
144 |
|
4 |
Position repeat |
E |
0.488 |
0.464 |
7.23 |
5.71 |
4.4 |
42 |
|
4 |
Position repeat |
W |
0.547 |
0.534 |
5.37 |
7.08 |
3.4 |
164 |
|
4 |
Position repeat |
E |
0.500 |
0.481 |
7.56 |
5.99 |
3.9 |
56 |
|
5 |
Position repeat |
W |
0.525 |
0.513 |
4.89 |
7.26 |
3.1 |
153 |
|
5 |
Position repeat |
E |
0.466 |
0.448 |
7.41 |
5.50 |
3.5 |
39 |
|
5 |
Position repeat |
W |
0.531 |
0.520 |
5.14 |
6.87 |
2.9 |
151 |
|
5 |
Position repeat |
E |
0.527 |
0.489 |
7.80 |
5.36 |
5.7 |
46 |
|
6 |
Position repeat |
W |
0.533 |
0.521 |
5.01 |
6.95 |
3.0 |
152 |
|
6 |
Position repeat |
E |
0.472 |
0.457 |
7.17 |
5.76 |
3.3 |
46 |
|
6 |
Position repeat |
W |
0.566 |
0.555 |
5.26 |
6.68 |
2.8 |
155 |
|
6 |
Position repeat |
E |
0.511 |
0.496 |
7.45 |
5.81 |
3.2 |
51 |
|
8 |
Aero tuck |
W |
0.276 |
0.266 |
5.45 |
7.88 |
2.9 |
136 |
|
8 |
Aero tuck |
E |
0.334 |
0.323 |
8.62 |
6.28 |
2.8 |
47 |
|
8 |
Aero tuck |
W |
0.279 |
0.271 |
5.56 |
8.54 |
2.8 |
147 |
|
8 |
Aero tuck |
E |
0.361 |
0.336 |
8.81 |
5.85 |
4.6 |
43 |
|
10 |
Baseline repeat |
W |
0.572 |
0.560 |
5.14 |
6.36 |
2.9 |
148 |
|
10 |
Baseline repeat |
E |
0.503 |
0.489 |
6.84 |
5.79 |
3.0 |
47 |
|
10 |
Baseline repeat |
W |
0.579 |
0.564 |
5.03 |
6.37 |
3.4 |
142 |
|
10 |
Baseline repeat |
E |
0.531 |
0.500 |
7.28 |
5.46 |
5.1 |
45 |
A3. Session settings and normalisation
|
Parameter |
Value |
|
Location |
Orlingbury, Kettering |
|
Date |
23 September 2026 |
|
Gated section |
693 m, gate A to gate B |
|
Elevation, gate A to gate B |
−8.8 m |
|
Air temperature |
12–22 °C over the session |
|
Wind speed |
4–11 km/h |
|
Combined mass |
70.20 kg |
|
Power meter slope |
1.000 |
|
Wheel circumference |
1.28 m (solved from GPS) |
|
Crr input |
0.00800 |
|
Crr at test temperature |
0.00824 – 0.00842 by run |
|
Probe pressure coefficient |
1.125 upright, 1.418 aero tuck |
|
Yaw offset |
1.28° |
|
Normalisation type |
Standard |
|
Yaw normalisation |
parabola, slope −0.001, stall angle 10° |
|
Air speed normalisation |
linear, slope 0.00159 m² per m/s |
|
Head / chest normalisation |
slope 0.0 (not applied) |
|
Normalisation reference |
5° crosswind yaw |
|
Lap (traverse pair) CdA SD |
0.0146 m², CV 2.73% |
|
Typical error of baseline mean |
0.527 – 0.544 m² (±0.0087) |
A4. Reynolds Number
The Reynolds number is the ratio of inertial to viscous forces in a flow, Re = vL/ν, where v is air speed, L a reference length and ν the kinematic viscosity of air — about 1.48×10⁻⁵ m²/s at 15 °C. It governs whether the boundary layer over a curved body stays laminar and separates early, leaving a wide wake, or transitions to turbulent and clings on further round, leaving a narrow one. Across that transition the drag coefficient of a rounded bluff body (a cyclist) falls sharply. The canonical onset for a smooth circular cylinder is Re ≈ 2×10⁵; surface roughness moves it down, to as low as Re ≈ 5×10⁴ for a rough body.
Taking the torso as the reference body and its streamwise extent as L, with air speeds as reported per configuration:
|
Quantity |
Upright (A) |
Aero tuck (C) |
|
Air speed (m/s) |
6.21 |
7.13 |
|
Torso reference length L (m) |
0.3 |
0.6 |
|
Reynolds number |
1.3×10⁵ |
2.9×10⁵ |
-
L is nominal, not measured. The torso is not a cylinder, and 0.3 m and 0.6 m are representative dimensions for an upright and an inclined torso rather than sensor readings. Reynolds number scales linearly with L, so both figures move directly with whatever reference length you pick.
-
The transition is a range, not a point. 2×10⁵ is the smooth-cylinder value. Clothing, helmet, hair and skin all trip the boundary layer earlier, and a sufficiently rough body can transition nearer 5×10⁴ which would put the upright case at or past onset and shrink the difference between the two columns.
- Viscosity moves with temperature. Across the session’s 12–22 °C, ν spans roughly 1.45 to 1.53×10⁻⁵ m²/s, about ±3% on every Reynolds number above.
- Speed and position are confounded. The tuck was ridden faster than the uprights and no configuration was deliberately swept across a range of speeds, so this session cannot separate the speed contribution from the position contribution. The figures argue that the transition sits in the right place to be part of the explanation. They do not measure how much of the 0.223 m² it accounts for, and nothing here should be read as doing so.
The normalisation assumes one slope for everything. The session applies a single linear air speed correction of +0.00159 m² per m/s to every configuration. Published field data put real CdA-against-air-speed slopes anywhere between −0.00406 and +0.0012 m² per m/s, so any configuration whose true slope sits away from the standard value carries a residual the normalisation has not removed.
Images from @B_W_C_P